
Broadband variability
Long-term X-ray observations have shown that black-hole X-ray binaries exhibit extreme, aperiodic variability on time scales of a few milliseconds to seconds. The observed light-curve displays various characteristic features which indicate that the underlying variability process is stochastic in nature and is thought to be intrinsic to the accretion process. A general idea is that this variability is driven by the inward propagating fluctuations of mass accretion rate on viscous timescales, although much remains puzzling about the physical process driving the fluctuations. To confirm this, we performed a GRMHD simulation of black hole accretion low with simultaneous analysis of other GRMHD simulations from the literature. With long-duration simulations (over 30s) assembled from numerical codes, this work is likely the most comprehensive investigation of variability in GRMHD simulations to date (Bollimpalli et. al 2021). The characteristics of the generated synthetic light curves are in broad agreement with X-ray observations. We found that the accretion rate from simulations does show evidence for inward propagating fluctuations by featuring a) Strong radial coherence below the viscous frequency, b) Positive time lags of variability at smaller radii compared to larger radii, c) Linear rms-flux relation derived from the power spectra and d) Log-normal distribution. Now, unlike the observations, we find the time lags are not frequency-dependent, and that the power spectra are dominated by the high-frequency variability above the radial epicyclic frequency. These are likely the results of non-dissipative fluctuations (such as p-modes), and suggest that the accretion rate, after all, may not be a good proxy for luminosity for these studies.
Distribution of accretion rate for the time segment during which accretion rate is reasonably stationary. The best fits of normal and lognormal distributions are shown in red dashed and blue solid curves, respectively.
Log-normal distribution of accretion rate implies underlying variability process is multiplicative in nature.


Radial coherence measured with respect to the inner radius. White dash–dotted curve represents the Keplerian frequency and the black dashed curve represents the viscous frequency.
Remarkable coherence below the viscous frequency -
propagating fluctuations
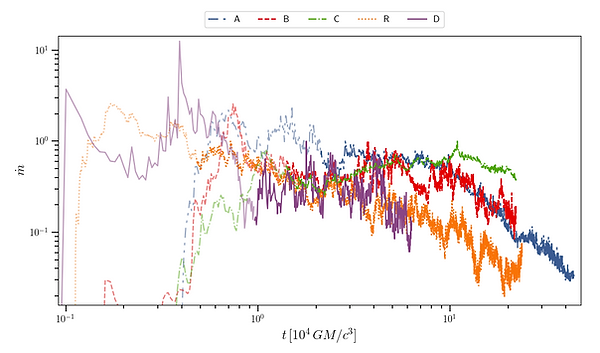
Accretion rate onto the black hole for different simulations

Time lags of the accretion rate fluctuations for radii 2, 6, and 10 gravitational radii with respect to 15 gravitational radius. The dashed line represents the viscous frequency at 15 gravitational radius.
Positive lags imply fluctuations are propagating inward.
rms–mean relation computed for the accretion rate at the ISCO.
Linear rms-flux relation implies that the higher the accretion rate, larger the variability.

Since these are non-radiative simulations, synthetic light curves can be generated from the simulations using a radially-dependent emissivity profile with different emissivity indices for hard and soft energy band light curves.
Power spectra (left panel in the below figure) and the time lag spectrum (right panel in the below figure), computed from the synthetic light curves in hard and soft energy bands, match well with overlayed with the observational data of Cygnus X-1 in the hard state, taken from Revnivtsev, Gilfanov & Churazov (2000); Nowak et al. (1999); Poutanen (2001).
Comparison with observations


Ongoing project:
Interestingly, the frequency-dependency of time lags is recovered in the synthetic light curves, although the time lags measured from the accretion rate remain frequency-independent. This indicates that dissipative processes could play a vital role in modulating the underlying variability in the accretion rate, as it is imprinted on the light curve. We are currently working with the GRMHD simulations that include radiative processes to explore this idea further.
Stay tuned!!